
First: Open Task Manager
1. Step First open the Windows 8 task manager using the known shortcut CTRL + ALT + DEL
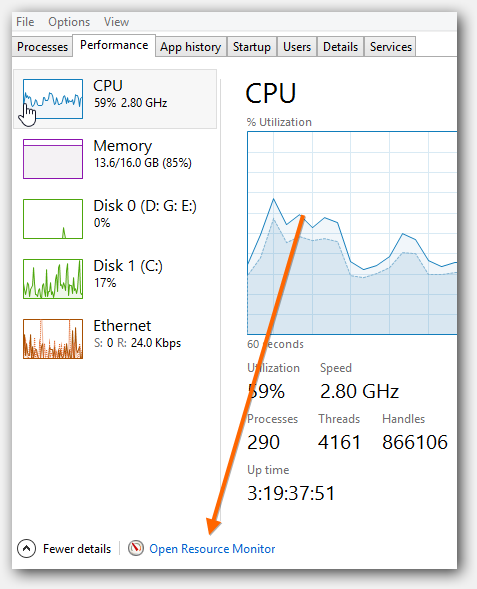
2. Step Once opened, go to the tab Performacen. YOu will see your currenty CPU utilization, how many processes are running, how many threads and handles your CPU is managing and your current uptime. Additionally, you can see important CPU specs like the max clock speed, the sockets, your CPU cores, logical processors, if virtualization is enabled and the size of your L1,L2 and L3 cache. All of those information may help you to figure out how good or bad your PC can perform under heavy load
3. Step At the bottom of all that is a small blue link Open Resource Monitor
4. Step Once you opened the Windows 8 task manager you can use the tabs to check various PC activity e.g. your CPU, memory, disk and network usage.
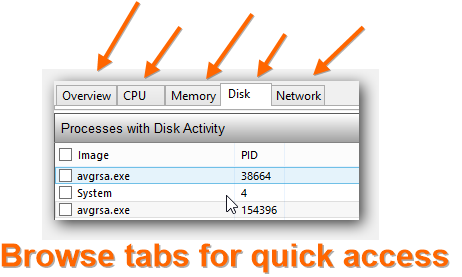
5. Step You should always check the disk to see what the system is currently writing to your disk – you can sort disk activity by Read or Write (B/sec) which is very handy to see the top paths that are currently in use
You can also use Windows 8’s resource monitor to generate a complete system health report