 If you’re interested in debugging a tool or finding out why a certain program keeps crashing there is no way around opening DMP (dump) files. In this guide we’ll show you how to open a mini dump file on Windows 8
Tip: Instead of working with Mini Dump Files you should use regular DMP files – you open them in the same way. You should also read our old guide on opening DMP files on Windows 7 here
Download Driver Kit
1. Step Download the Windows Driver Kit 8 from Microsoft’s website at http://msdn.microsoft.com/en-US/windows/hardware/hh852362
2. Step After you have downloaded the Driver Kit on Windows 8 run the installer and install it on a disk with a lot of space. Debugging files can be quite large
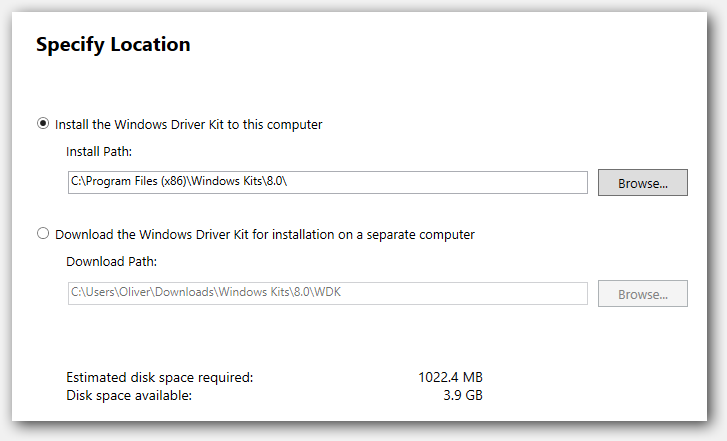
3. Step Depending on your needs, you may want to download the WDF co-installers – however this will only necessary if you are building device drivers
Start WinDBG
4. Step Alright, now to go to your Start Screen and on the far right you will find WinDBG:
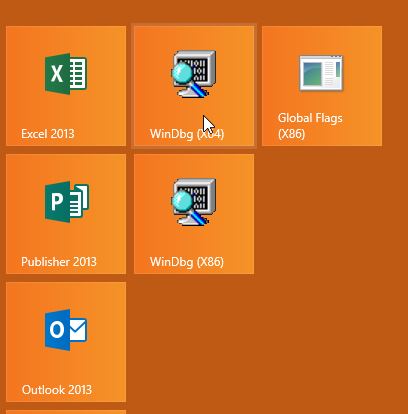
5. Step Open the correct version for your operating system either 32-bit or 64-bit and
6. Step Click on File and select Open Crashdump, then browse for your TMP.MDMP file or .DMP file and open it
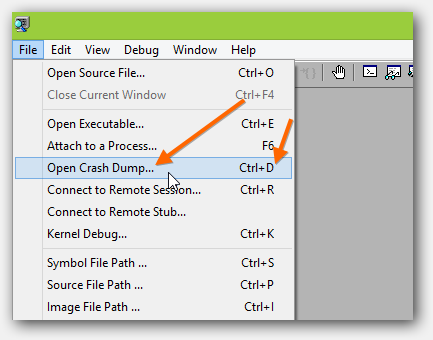
7. Step By default Windows 8 stores mini dump files in C:\Users\Oliver\AppData\Local\Temp\ (replace Oliver with your own username)
8. Step You will get something like this
Microsoft (R) Windows Debugger Version 6.2.9200.20512 AMD64
Copyright (c) Microsoft Corporation. All rights reserved.Loading Dump File [C:\Users\Oliver\AppData\Local\Temp\WERDB5.tmp.mdmp]
User Mini Dump File: Only registers, stack and portions of memory are availableSymbol search path is: *** Invalid ***
Symbol loading may be unreliable without a symbol search path.
Use .symfix to have the debugger choose a symbol path.
After setting your symbol path, use .reload to refresh symbol locations.Executable search path is:
Windows 8 Version 9200 MP (6 procs) Free x86 compatible
Product: WinNt, suite: SingleUserTS
Built by: 6.2.9200.16384 (win8_rtm.120725-1247)
Machine Name:
Debug session time: Mon Jun 3 13:18:12.000 2013 (UTC + 2:00)
System Uptime: 2 days 21:47:49.103
Process Uptime: 0 days 0:00:02.000
……………………………………….
This dump file has an exception of interest stored in it.
The stored exception information can be accessed via .ecxr.
(1ff14.1fcf4): CLR exception – code e0434f4d (first/second chance not available)
*** WARNING: Unable to verify timestamp for ntdll.dll
*** ERROR: Module load completed but symbols could not be loaded for ntdll.dll
Unable to load image C:\Windows\System32\KERNELBASE.dll, Win32 error 0n2
*** WARNING: Unable to verify timestamp for KERNELBASE.dll
*** ERROR: Module load completed but symbols could not be loaded for KERNELBASE.dll
eax=00000000 ebx=00000000 ecx=00000001 edx=00000000 esi=0070d6bc edi=000002fc
eip=7726dc34 esp=0070d678 ebp=0070d6e0 iopl=0 nv up ei pl nz na pe nc
cs=0023 ss=002b ds=002b es=002b fs=0053 gs=002b efl=00000206
ntdlldc34:
7726dc34 c20c00 ret 0Ch
Load Correct Symbols
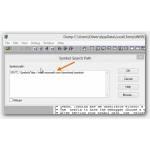
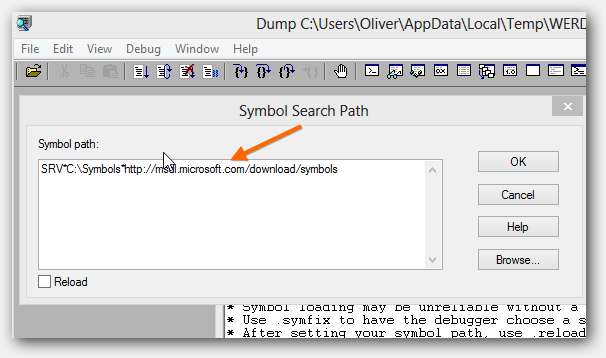
9. Step Next, we need to load the correct symbols for our debugging process – hit CTRL + S and copy and paste this into the field: SRV*C:\Symbols*http://msdl.microsoft.com/download/symbols
10. Step It will now download the symbols to C:\symbols – you do not have to create it manually
11. You may receive the error No runnable debuggees error in ‘g’
12. Hit F5 to refresh the Mini dump file
13. Continue reading here on how to properly Analyze a DMP file
14. Done – spend some time on debugging for best results
Also read our guide on fixing blue screens