 Computers can run into problems, slowing down your hardware, if you want to use Windows effectively, you should create and advanced system performance report to find out what processes use a lot of computing power
Creating The Data Collector Set
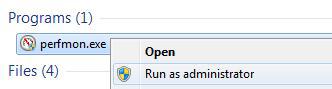
1. Step Click on Start and enter perfmon.exe – then right-click on the item that appears and select Run as admin
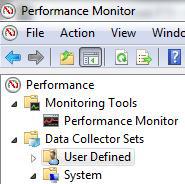
2. Step Now uncollapse Data Collector Sets and click on User Defined
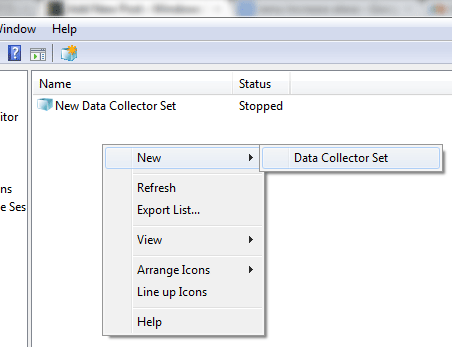
3. Step Ok, now right-click into the right pane (the white area) and click New -> Data Collector Set
Settings
4. Step Enter a name for your system performance report – e.g. Performance Analysis or whatever you want. Make sure to select “Create from template”
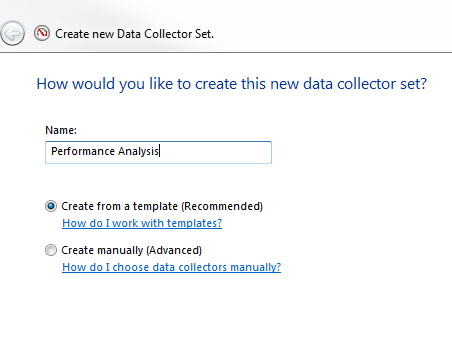
5. Step Click Next
6. Step If you want to improve your performance, you should select System Performance, if you believe there is a severe problem select System Diagnostics instead. Click either Finish or Next if you want to customize the path
7. Step If you clicked Next, you can select a different path to store your Performance Logs. The default is %systemdrive%\PerfLogs\Admin\Performance Analysis
8. Step In the last step, you could run this as another user but in this case we select Default and then click on Finish
9. Step Finally, select the item that appears (it will use the name you entered in step 4) and hit the green play button
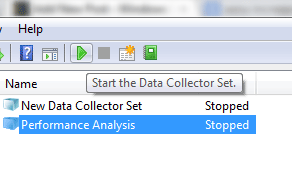
10. Step Done, Windows 7 stored the report in C:\PerfLogs\Admin
Locating The Performance Report
11. Open the Windows Explorer via Windows key + E and go right to C:\
12. Double-click on PerfLogs and confirm the UAC prompt
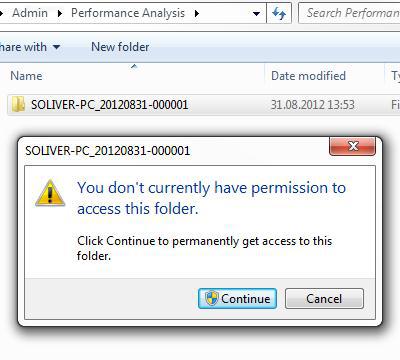
13. Go deeper in, to the folder C:\PerfLogs\Admin\Performance Analysis (where Performance Analysis is the name you entered in step 4). You will see a folder in there with your username in it e.g. SOLIVER-PC_20120831-000001
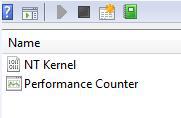
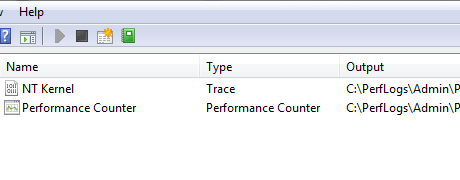
14. In there, you see a file called report, report.xml, report.xsl, rules.log, Performance Counter.blg and NtKernel.etl
Open Report.Html For Further Performance Analysis
15. Open Report to analyse your PC
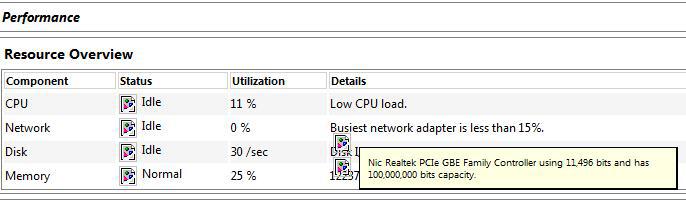
You will get all sorts of useful information like disk IO, busiest network adapter, CPU load, memory utilization, top disk by IO rate, processes and their CPU usage, memory stats and so on
This can help to a great extent to find possible problems with your PC. It can even help to find problems with DLL files like rundll32