 If your average CPU load is going up, one cause could be system interrupts that use a high percentage of your CPU power.
In this article we will explain how to identify the bottleneck of your drivers, possibly causing a high CPU usage. Often corrupt drivers, IRQL errors, etc. can cause problems and a spike in CPU usage. So, if you believe your PC needs to be fixed, this will be a good starting point.
Getting Started: Download Windows Performance Kit + DPC Latency Checker
Before you get started, we are going to download some tools to further analyze the processes. The Windows Performance Kit does a good job at finding processes and drivers that are causing a high cpu usage.
1. Step Head over to Microsoft.com and download the Microsoft Windows SDK for Windows 7 and .NET
2. Step Run and install the winsdk_web.exe. If you already installed the Windows Debugging Tools or other included tools it will show that, simply select Change during the installation process.
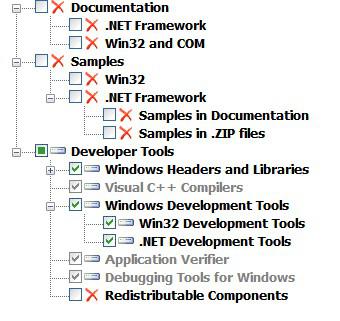
3. Step You don’t have to install the C++ compilers or the libraries, but make sure to check the option Win32 Development Tools:
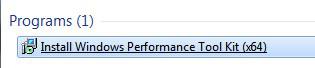
4. Step When you are done enter Windows Performance Tool Kit into the search bar on your Start menu, select the top result and follow the instructions.
IMPORTANT: If you are on 32-bit and it doesn’t show x32, go to C:\Program Files\Microsoft SDKs\Windows\v7.0\bin and double-click on wpt_x86.msi. wpt_x64.msi is for 64-bit systems. wpt_x64.msi is for Itanium Windows.
5. Step When you are done, download another tool called DPC Latency Checker from here.
IMPORTANT STEP: Disable Paging Execute
Before we can use xperf to properly analyze your driver problems we have to disable paging executive. If you run the commands below without doing this you will get the error:
xperf: warning: This system is not fully configured for x6
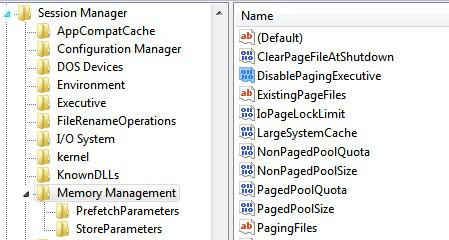
Please modify the registry under:HKEY_LOCAL_MACHINE\System\CurrentControlSet\Control\Session Manager\Memory Management
and set the value:
DisablePagingExecutive (REG_DWORD) = 1
Then reboot before retrying tracing.
Note: Tracing has been enabled, this is just a warning.
You can either follow the instructions by opening the registry editor and changing the value to 1
Or simply run this command via cmd:
reg add "HKLM\System\CurrentControlSet\Control\Session Manager\Memory Management" -v DisablePagingExecutive -d -t REG_DWORD -f
Using DPC Latency Checker
Now it’s time to use some of the tools we downloaded. First start the dpclat.exe that we downloaded, no worries it’s a portable app. If you really have some driver problems causing system interrupts you should definitely see some yellow and red bars:
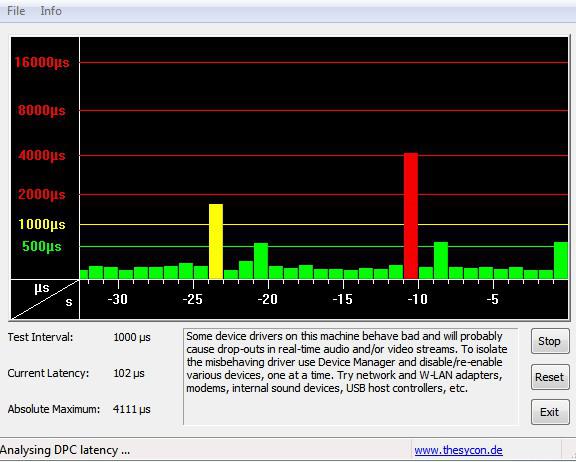
A textbox will give you some first useful instructions:
Some device drivers on this machine behave bad and will probably cause drop-outs in real-time audio and/or video streams. To isolate the misbehaving driver use Device Manager and disable/re-enable various devices, one at a time. Try network and W-LAN adapters, modems, internal sound devices, USB host controllers, etc.
Using XPerf To Find Drivers With High CPU Usage
1. Step Open an elevated command prompt
2. Step Enter xperf -on latency -stackwalk profile
If you get the error xperf: error: NT Kernel Logger: Cannot create a file when that file already exists (0xb7) then all you have to do is reboot!
3. Step Wait a minute and work with your computer for a while as you normally would, then enter:
xperf -d CPUInterrupt.etl
The performance tool now capture all events and stored the results in a file DPC_interrupt.etl
As the tool points out:
The trace you have just captured “DPC_Interrupt.etl” may contain personally identifiable information, including but not necessarily limited to paths to files accessed, paths to registry accessed and process names. Exact information depends on the events that were logged. Please be aware of this when sharing out this trace with other people.
4. Step Go To C:\Windows\System32 using the Windows Explorer (Windows key + E)
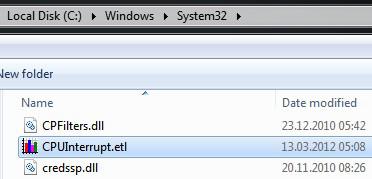
5. Step Double-click on CPUInterrupt.etl to open the Windows Performance Analyzer
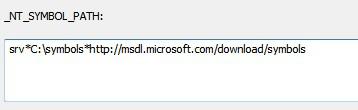
6. Step After a short time, click on Trace, Configure Symbol Paths

7. Step For the _NT_SYMBOL_PATH enter srv*C:\symbols*http://msdl.microsoft.com/download/symbols
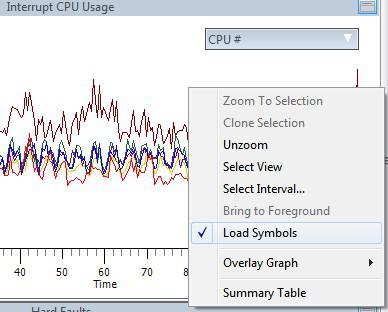
8. Step Now scroll down to Interrupt CPU Usage, right-click onto the graph and select Load Symbols
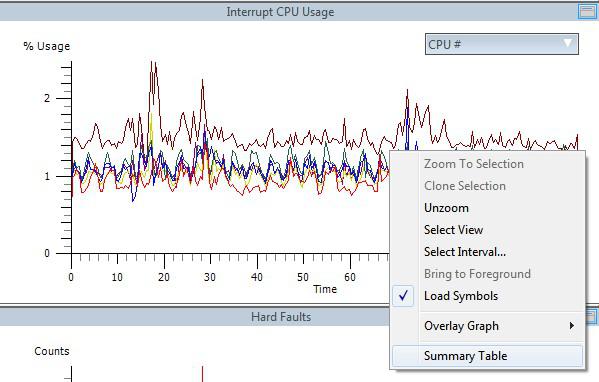
9. Step Next, right-click again and select the bottom entry Summary Table:
10. Step It is possible you have to repeat step 9 if it closes automatically, but in the end you should get this:
Obviously, you will have different entries. For me the file hal.dll is causing the most system interrupts:
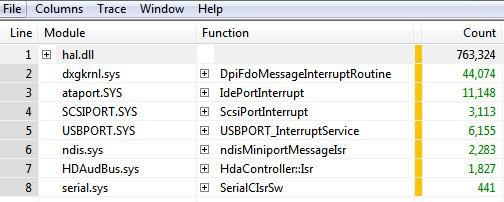
Next, we have to find out what exactly hal.dll is. In your case, the USBPort.SYS or the NDIS.sys or dxgkml.sys might have the highest count. If that is the case you have to research other files.
What’s next?
Next, we recommend that you disable the components that are related to your problem. Let’s say USBPort.SYS is causing the problems for you, then unplug USB devices one by one and check. Also disable USB hubs in your device manager
In General:
- Disable network
- Unplug USB devices
- Disable USB hubs in device manager
- Re-install motherboard drivers
- Upgrade BIOS
- Update graphic card drivers, update CCC.exe (Catalyst Control Center!)
- Change keyboard/mouse


Help I get interrupts from ACPI.sys. I’m not sure what to look at.
pleaaaaaaaaase help I don’t know what to do because I have xperf for windows 8 :(
Xperf on Windows8 should be the same – what exactly is your problem? You need to be more specific. Thanks!
So I know this was a while ago but i’m getting the HAL.dll throwing me loads of interupts and i’ve tried researching how to fix this but people aren’t generally giving solutions for that, they’re just skimming over it. Since it’s the highest one in your example have you got a way of fixing it?
Mat, I managed to fix it by re-installing USB drivers until I found one that is better for my board
Also follow the tips at the buttom, unplug ALL devices including drives, USB and even remove the USB hub from your device manager
Additionally, make sure to disable all services that are not 100% required
Have you recently installed any hardware or software that could be causing this?
How old is your hardware? Could it be dying?